Rheaply is continuing our guest blog series! We’re inviting contributors from the world of sustainability and circularity to share their thoughts, opinions, and hopes for the future of the industry.
This article comes from our friend Jeff Frost, Materials Practice Lead at Brightworks Sustainability.
A letter to the industry:
It is well understood that the construction and operation of buildings represents over 40% of annual carbon emissions. These emissions are divided into two primary camps, operational emissions (from energy use) and embodied carbon emissions (from the manufacturer of the materials required to build said buildings). According to the International Energy Agency, these emissions will need to fall by 50% by 2030 to stay on track for meeting net zero carbon targets for 2050. This 50% reduction is not a partial accounting, it is based on total emissions and includes all energy and all materials used on the project.
To date, the building sector has found many innovative ways to address operational emissions while emissions from embodied carbon have largely been ‘partial’ in nature, meaning the bulk of our industry work has been on parts of a whole – materials, like concrete, structures, roofing, siding, glazing, along with interior walls, glass and select finishes like flooring, ceilings and doors. What is missing from this analysis, confusingly referred to by our industry as a Whole-Building Life Cycle Analysis (WBLCA), are the remaining construction materials, which include the entire MEP/IT/AV (mechanical, engineering, plumbing, etc.) system, as well as any and all furniture. The industry has long assumed that the emissions from these two components are not material to a building or organization’s emissions, but no one had ever measured them – until now.
Salesforce and embodied carbon
Starting in 2019, Salesforce, a cloud-based software company, wanted to better understand the total embodied carbon impacts of their growing real estate portfolio, inclusive of these elusive emissions. At the direction of their Real Estate and Sustainability teams, Brightworks Sustainability, in collaboration with WAP Sustainability began developing a methodology that could be followed to determine an embodied carbon factor for a wide range of products; those with Environmental Product Declarations (EPD) and those without. The outcome of this work resulted in the World Resource Institute (WRI) Greenhouse Gas (GHG) Protocol Sector Supplement, formally approved in November 2021.
This methodology was then applied to a Salesforce project, through all phases of our work. The project was a small two-story, tenant improvement (TI) that was representative of a typical Salesforce workplace. Salesforce spaces are consistent from project to project with only minor deviations. The design and materials have been highly refined, and many years have been spent optimizing the palette and material usage. During construction, bill-of-materials (BOM) data from every subcontractor on the project was collected. To save time and help make this effort easier on the subcontractor, we asked for their purchased quantities, no special exclusions; if they purchased it for the project, we wanted to consider and include it in our ‘total carbon’ analysis. These quantities naturally included all overage/waste, a piece of the puzzle that cannot be estimated from drawings. With little pushback, we captured every material from every subcontractor.
The construction materials portion of the study was completed in 2021. The study indicated construction materials, everything inside the space that was not furniture or MEP/ITAV related, resulted in an embodied carbon factor of 70 kg-CO2e/m2. In 2022, Furniture was completed, and resulted in an embodied carbon factor of 82.54 kg-CO2e/m2. The furniture results, which we expected to be lower, came in 18% higher than the Construction Materials for the same space. In 2023, we repeated the furniture assessment on a three-floor project for the same client and found the results to be statistically insignificant, varying by less than 1%, despite the programmatic changes reflecting a post-COVID WFH program.
The results here tell a larger story that a traditional WBLCA analysis is not sufficient for those with net zero ambitions; furniture must be taken into consideration when defining a net-zero carbon pathway.
Beyond furniture and construction materials
We now have the two segments of our emissions for this TI study: construction materials and furniture, which leaves MEP/ITAV. The MEP/ITAV calculations are deserving of their own write-up, and this information is to be published in a separate, updated blog forthcoming in 2024 following the completed analysis.
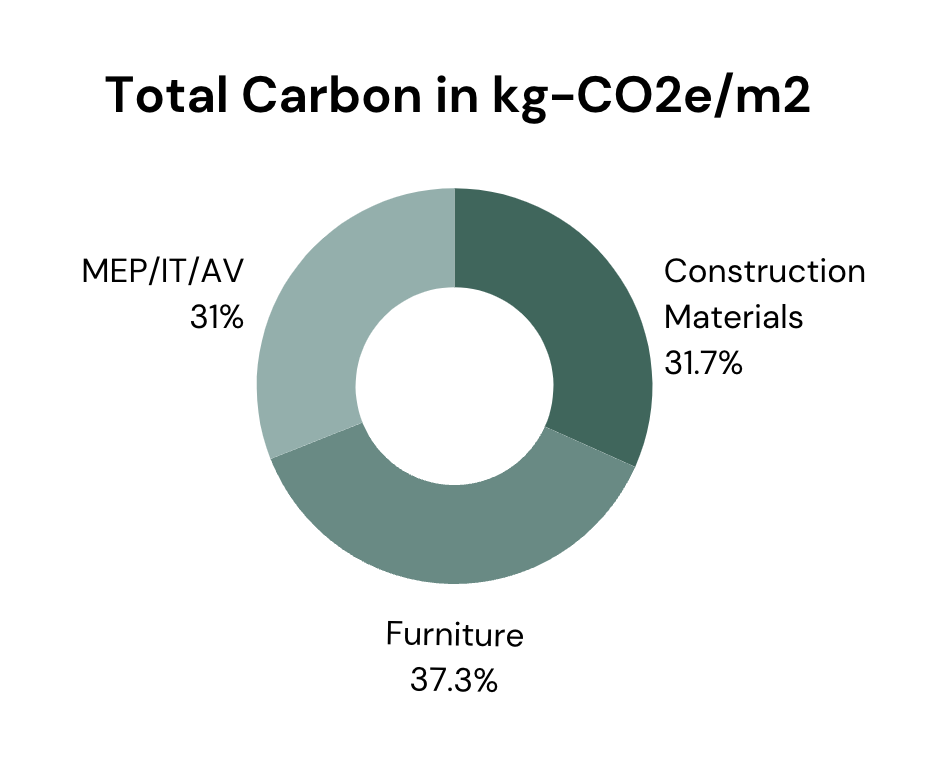
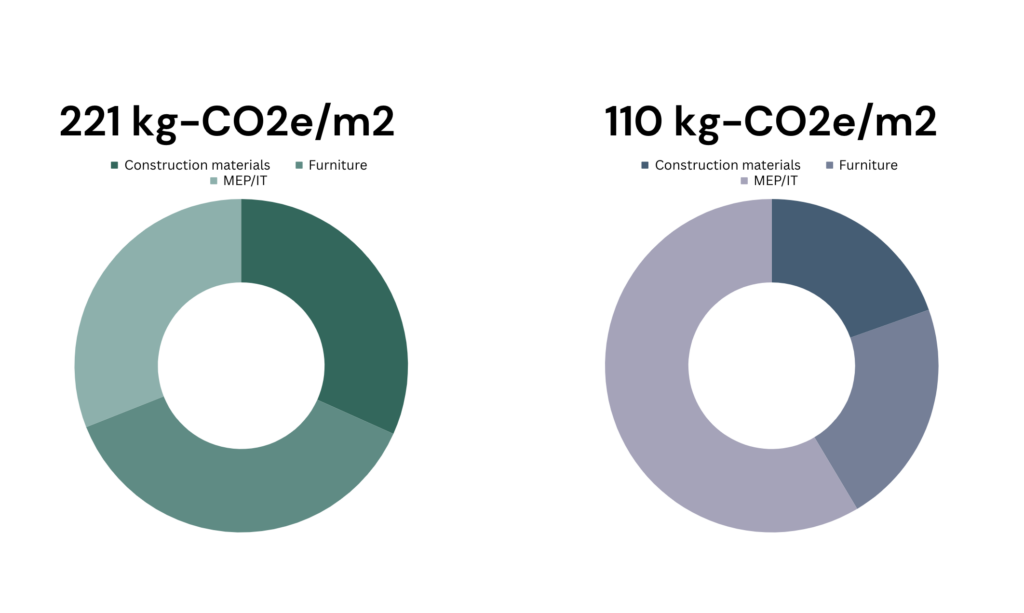
For purposes of this exercise, we can estimate with confidence the total embodied carbon factor to be ~68 kg CO2e (or about 31% of the total). If we add up all embodied carbon factors, we get a total embodied carbon factor of ~221 kg-CO2e/m2.
This would make Construction Materials 31.7%, Furniture 37.3%, and MEP/IT 31%, of that total, meaning that both Furniture and MEP/IT equipment are highly material to a building’s embodied emissions.

To hit our 50% reduction target, we would simply need to reduce emissions down from 221 kg-CO2e/m2 to 110 kg-CO2e/m2 (half, or ½ of 221) – Right?
Right. But it is not that simple.
Emissions mitigation
The market for embodied carbon information for MEP/IT materials is in its early days, meaning many manufacturers are still learning about the need/importance for EPDs and emissions mitigation strategies. The first EPDs produced by any manufacturer tend to be about discovery, learning what their emissions are and hopefully, starting to identify the emissions hot spots in their LCAs. EPDs produced have a 5 yr. shelf life. Let us hope that during this next 5-year period, manufacturers are actively implementing reduction opportunities, such that when they update their EPDs in 2028/29, that they can show some level of reduction in their next EPD. The point here is that even with ramped up awareness and demand, it’s unlikely that we will see significant reductions in the MEP/ITAV products by 2030.
This means then that the bulk of our emissions reductions will need to come from construction materials and furniture. Again, in this building TI example, in keeping with the client’s goals and the guidance from the IEA we reviewed at the beginning of this conversation, we need to half emissions to 110 kg. Again, here is where we start – with a third of our embodied emissions divided between Construction Materials, Furniture, and MEP/IT/AV equipment, loosely speaking.
If MEP/IT emissions can be reduced 10% by 2030, that puts MEP/IT at 62 kg-CO2e/m2. This means we have a remaining embodied carbon “budget” of 48 (110-62) kg-Co2e/m2 if we plan to hit our 2030 target. Now, let us assume for the sake of this exercise that this is split equally between construction materials and furniture. This would mean that they both need to equal 24 kg-CO2e/m2.
This means that we need to reduce emissions from construction materials by 65.7%, and we need to reduce emissions from furniture by 71%.

What does it all mean?
Picture this for a second. If you can visualize a typical class-A office space full of materials and furniture, imagine that space with 65-70% less stuff.
Now, the good news is that from what we are seeing in the market around TI construction materials, mostly interior finishes, achieving a 65% reduction in carbon emissions by 2030 seems feasible. There are already a handful of products that could be used to achieve those results, including many bio-based material innovations. But this is a limited group and does not represent a large pool of options that many clients and designers would like to see, often needed to create a three-party specification (meaning, three companies can comply with the requirements).
So, while the market for interiors is on the right path and sure to keep making progress, the next piece to prioritize is furniture.
Furniture’s embodied carbon tends to be split into two camps; systems furniture (Desks, Chairs, Monitor Arms, and Wall Panels by companies such as Steelcase, Miller-Knoll, Haworth, etc.) and, well, everything else. Systems furniture has had quite a bit of attention as manufacturers already have had to develop carbon or emissions metrics and EPDs to compete for RFP (Request for Proposals) selection. These pieces tend to have basic emissions or carbon data available, but manufacturers need to break down this data to allow the embodied emissions results to be as customizable as their systems (fabrics, different base configurations, with or without arms, etc) allowing owners to better identify low-carbon specifications. Even presenting embodied carbon or emissions data for the top 5-8 components would be a huge win.
The rest of the furniture market is devoid of useful carbon and emissions data (outside of our detailed studies). Large and small manufacturers alike struggle with the staffing costs of calling down one’s supply chain to create LCAs and EPDs for highly customizable furniture products – and that is before spending the money needed to make noticeable emissions reductions. I am convinced that a solution like the one found for concrete, Theta Tool, by WAP Sustainability is what is needed to bring the cost of generating EPDs down considerably for furniture makers. WAP Sustainability’s Theta Tool could help get the custom furniture industry unstuck in creating embodied carbon information for commercial and residential manufacturers, but again, that is just a small piece of the puzzle.
In the meantime, because none of this is likely to be solved quickly or perfectly, we still need to reduce our furniture emissions.
Enter reuse
Building owners and lessors often lack the systems and processes to facilitate reuse. Too often, the decommissioning of a space is done with little notice, forcing many of the goods to be directed to donation marketplaces or more commonly, the landfill. According to the US EPA, as reported in the NYTimes, “Americans throw out over 12 million tons of furniture annually with over 80% going to landfills.
Many of these 12 million tons of furniture could be reused, refurbished, reupholstered, repaired or donated. Much of this landfilling could be avoided on the commercial side and it starts with the decommissioning playbook.
An asset management tool is one critical component of the decommissioning playbook, allowing companies to track pieces being decommissioned and where they are redeployed. The other critical components of the playbook is a logistics company, someone to remove and redeploy pieces within your portfolio, a resale tool/company, that focuses on selling goods outside of your organization for credit applied to future sales (this works the best for tax purposes), and a donation company that can take everything else and find new homes through donations to non-profit organizations, schools, and other local community organizations. All four parts are necessary, along with a connected ecosystem of buyers.
Reuse alone won’t lead to sizable reductions until such an ecosystem is created. Through shared purpose, ecosystem partnerships are emerging that are bringing their expertise together, such as a partnership between One Workplace and Reseat.
In addition, there are other tools such as Rheaply, that are working on regional hubs and markets for reuse. The biggest opportunity is to measure the impact from furniture and then start exploring tangible reduction opportunities. Brightworks Sustainability and WAP Sustainability have enjoyed the opportunity to support
Salesforce in these explorations and look forward to sharing future details and helping other clients better understand their own embodied carbon impacts.
We will be wrapping up our study of the MEP/ITAV equipment at the end of 2024 and will be sharing results and more on this topic, including findings from our regular meetings, at the next Living Future 24 in Atlanta.
Best,
Jeffrey Frost & Brightworks Sustainability
Note to the reader:
If you’d like to read more about this work, including calculations and future findings, you can expect a more detailed blog on Brightworks Sustainability’s website, to be released in 2024. We welcome additional analysis from our peers and the publication of additional data on the materiality of Furniture and MEP/ITAV emissions. Please be in touch if you would like to discuss expanding your WBLCA to include these critical components.
If you would like to read more about Salesforce and their commitments to climate change, you can visit the link here. Salesforce design materials have been optimized for many years to reduce impacts and quantity of materials used. The numbers represented here are not typical for all tenant improvements. In addition, the values highlighted here are ‘baseline’ values and do not reflect reductions that have taken place over the intervening years to support Salesforce’s Net Zero Now commitments.

